THE WALK-AWAY CIRCULAR DICHROISM
INSTRUMENT FOR REGULATORY ENVIRONMENTS
Chirascan Q100 provides detailed insight into the Higher Order Structure (HOS) characteristics of complex biomolecules.
Reproducible robotics and high performance circular dichroism spectroscopy combine to generate quality data compatible with the most stringent statistical analysis methods. The result: objective, statistically-validated HOS comparisons.
Fully integrated for unattended operation, Chirascan Q100 saves days of operator time, analyzing 48 buffer-sample pairs over 24 hours whereas an experienced operator processes up to 14 samples per day on a manual system.
Ensure reliability with our five-year warranty, providing extended protection and peace of mind. This additional coverage ensures long-term support, safeguarding your investment.
Higher signal:noise ratio than conventional photomultiplier tube detectors
Accurate normalization from simultaneous measurement of absorbance and CD
For being able to identify minor spectral differences due to subtle changes in molecular structure, high sensitivity is key—particularly for tertiary structure assessment by near-UV CD and HOS comparisons, e.g., for forced degradation studies.
Calibration with confidence
Accurate CD values across entire wavelength range
Overcome challenges of chemical calibration
Optics-based, multiwavelength calibration
Conventional chemical calibration methods require considerable skill in preparation. Standards, such as camphor-10-sulfonic acid (CSA), are unstable, photolabile, and hygroscopic. In addition, single-wavelength calibration (290.5 nm) assumes the same linear response at all wavelengths.
The optics-based, multiwavelength calibration method used for Chirascan V100 and Chirascan Q100 systems overcomes these challenges. The correct calibration is applied to every wavelength to yield accurate CD values.
Features and accessories
Chirascan systems are supplied with the features and accessories required for acquisition of high quality data from ‘day one’.
Dissipates heat from sample chamber and sample storage Peltiers
Avalanche photodiode detector
Highest sensitivity (high signal: noise)
Optics-based, multiwavelength calibration
For CD accuracy at every wavelength
Fixed flow cells
Eliminates errors of cuvette handling
Recognized by Chirascan Control to select run/wash/dry protocols
Choice of pathlength to optimize concentration and absorbance
Cuvettes and holders
Selected for far- and near-UV CD analysis of biomolecules (single sample mode)
HOS Comparison Software
Optimized for Chirascan Q100
Confirming the statistical significance of any detected change in HOS requires a minimum of five sample replicates to enable robust analysis*. HOS comparison software is therefore optimized for analysis of the raw (unsmoothed) data generated on a Chirascan Q100 system to ensure
An ability to detect minor changes in HOS
An autosampler and flow cell combine to increase reproducibility by eliminating variability due to manual handling of samples and cuvettes
An avalanche photodiode detector achieves a sensitivity far greater than a conventional photomultiplier detector
An ability to increase number of replicates without increasing demands on operator time
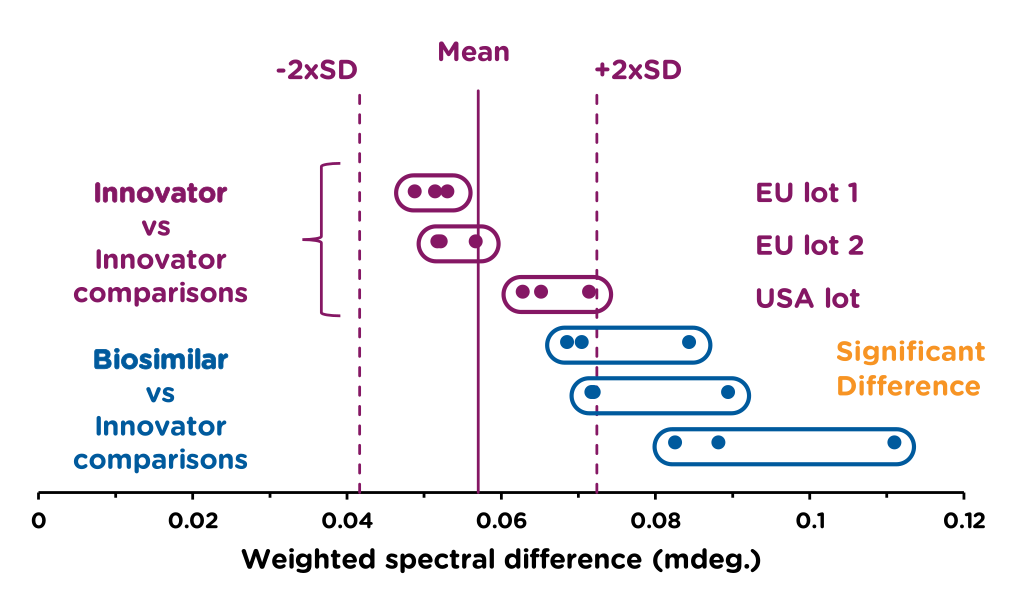
The software includes comparison methods and statistics associated with several statistical methods. However, we recommend calculating z-scores to quantify the similarity between a single spectrum and the reference dataset for each sample using ‘weighted spectral difference’ Dinh et al.
*Analyses with three or four replicates can be sufficient for proof of principle studies, but statistical analysis with less than three replicates is not mathematically possible
Note: t-tests are not recommended for HOS comparisons and are absent from the statistical approaches recommended by regulatory agencies at this time.
HOS Comparison software enables calculation of weighted spectral difference scores for reference and sample datasets – converting spectra into numerical data.
These scores are then exported and used to generate a quality range test or equivalence test as recommended by the FDA.
Data obtained on a Chirascan Q100
Research Insights
Dr Nick Larson
Dr. Nick Larson, a seasoned expert in protein and oligonucleotide therapeutics, leverages the Chirascan CD spectrometer in his work on a wide range of therapeutics, from protein-based drugs to advanced gene-silencing molecules.
Dr Athi N Naganthan
Dr Athi, a professor in the Department of Biotechnology at IIT Madras, leads the Protein Biophysics Lab, where he studies protein folding, stability, and interactions. His research utilises techniques such as Circular Dichroism spectroscopy to investigate protein-antibiotic interactions, bacterial chromatin organisation, and DNA binding kinetics, contributing to a deeper understanding of molecular mechanisms in health and disease.
User Cases
Applied Photophysics is a company with a prestigious legacy and has been supporting scientists for over 50 years.